• About the course
  • Syllabus

AMST2661 Visualizations in the Humanities

~ Projects and thoughts to share with the class

AMST2661 Visualizations in the Humanities

Category Archives: weekly writing

Process as value

16 Saturday Nov 2013

Posted by nicolemeehan in weekly writing

≈ Leave a comment

Tags

3d print, 3D visualization, digital humanities, Smithsonian, visualization

Definition of 'maker'

Use of the term ‘maker’ to describe the 3D printing community was one I was not aware of.  I think it is interesting to consider the word in this context alongside the definition above.  As Neely and Langer quoted from The Economist in their article Please Feel the Museum:  The Emergence of 3D Printing and Scanning, “The maker movement is both a response to and an outgrowth of digital culture…many people who spend all day manipulating bits on computer screens are rediscovering the pleasure of making physical objects”.  This return to materiality seems to be slightly odd to me.  Many of the examples in this weeks readings show makers creating miniature version of sculpture, or even integrating different sculptures in a mash-up, however these are missing their initial textural element.  They may be as accurate as possible in terms of form, but in terms of texture they are all the same, which was obviously not the case in the past.  

I agree that 3D printed objects are useful for all of the reasons outlined in 3D Scanning in the Museums:  A Q&A with the Smithsonian’s “Laser Cowboys” but I do think they miss something.  I think their value is in their process of creation, perhaps, and not the result.  Here is an example of an artist, Gilles Azzaro who has confronted sense to a certain extent – he has created and printed a visualization Barak Obama’s State of the Union address.   Pressing the ‘start button’ plays a recording of the speech and a laser tracks progress through the speech upon its 3D printed counterpart.  Again it is the process that is of interest here, and the fact that it took 350 hours to print.

3D print of Obama's State of the Union address

Something else I considered was how our interpretation of an object is formed partially from our knowledge of how it was created.  As a former archaeologist this is an incredibly important part of how we understand objects, and so I wonder how 3D printed object will be viewed by the archaeologists of the future?

Layers of interpretation

10 Sunday Nov 2013

Posted by nicolemeehan in weekly writing

≈ 1 Comment

Tags

archaeology, digital humanities, Immersion, museums, visualization

I felt a sense of frustration in Bonnett’s 2003 article Following in Rabelais’ Footsteps:  Immersive History and the 3D Virtual Buildings Project.  Whilst he perceived the benefits of using a 3D environment to teach students to confront the issues associated with creating visualizations from an incomplete historical record, it was clear he thought the technological limitations were restricting its potential.  Has access to immersive realities changed in the past decade?  We do see them feature ever more increasingly in the museum setting but as for the classroom, I am unsure.

I think once more we are faced with the question – do visualizations teach us anything new about our research, anything we do not already know?  In most cases I do not think it does.  But I do see potential, for example in reconstructions of ancient cities we can decipher new correlations between building and monuments that may not have been obvious before.  Here I mean in terms of sight lines and settings (as researched by Elizabeth Marlowe in Ancient Rome), the connections that would have been assumed by people in the past, but are not necessarily obvious now.  Of course, it takes vast resources to build an environment that would be conducive to making these discoveries, something that the digital humanities often lack.  And so maybe Marlowe’s architectural drawings are an easier way of demonstrating her theory visually.

There is another issues to be considered, relating to the interpretations we make during the 3D visualization process, both in computer and caved based cases.  We experience virtual realities that have been created by another’s perception of a past reality, we look through their eyes, so to speak.  It seems to me there are many layers of interpretation involved in creating such models – for example in reconstructing a historic building, there are interpretations made concerning the difference between the plan and the building that was actually constructed, interpretations of the gaps in the historical record and how they should be presented, interpretations made by the designers of the interface which frames our visualization and so on. As Diane Farvro mentions immersive realities necessitate the addition of “aural and kinetic” layers which will add yet another layer of interpretation.  How can we hope to recreate the sound and textures of the past accurately?  However despite the associated issues we push on, and I think we are right to do so.  Humanists work within a society that is increasingly connected to 3D representations in advertising, gaming and film, to mention a few.  An expectation has been created and the humanities must keep up.

Network Analysis – Nicole

20 Sunday Oct 2013

Posted by nicolemeehan in weekly writing

≈ Leave a comment

Tags

digital humanities, network analysis, Research

How are networks useful in the digital humanities, both at a micro (network analysis) and macro (research network) level?  Many of this week’s readings attempted to address these questions.

Scott Weingart cautions us to use network analysis wisely, and I think he is right.  There is a tendency to jump on the new-tool-bandwagon, regardless of how useful it may be for particular types of research.  However, there are many cases where network analysis can, and should, be utilised.  As Manual Lima says of the visualizations on his VisualComplexity site  “all projects have one trait in common: the whole is always more than the sum of its parts”.  How can humanists know when it is appropriate to use network analysis?  I think the only answer to this is through education, we need to be able to fully understand questions such as; what exactly is network analysis?  What is the underlying theory?  What are its limits?  Weingart tackles this adeptly in his Demystifying Networks blog post.  I found it useful that he stressed the limitations of the algorithms behind the analyses, making it clear that two different types of edges, directed and undirected cannot be represented within the same visualization meaningfully.  Much of what Weingart describes would be implicitly understood in ‘real life’ but are important to consider and address in network analysis.

The second idea of networks, the macro, that the digital humanities needs a defined global scholarly network is a logical one.  In theory this is an excellent opportunity for the digital humanities to define itself, to organise and optimize research.  If it were operating discretely this may be achievable, but in reality we know this is not the case.  The humanities by its very nature is interdisciplinary, yes we may not have the ‘generalists’ of the past that Grafton mentions but we certainly engage in cross-disciplinary research (11).  There also appears to be a knowledge gap that must be bridged before this would be possible, but as we see in the conversation between the philosopher and the computer scientist in Scholarsource:  A Digital Infrastructure for the Humanities this can be achieved.

An animated network analysis of events in the Game of Thrones Book/TV Series:  Useful or not?

Game of Thrones network analysis

Chronologies, Week 4

29 Sunday Sep 2013

Posted by nicolemeehan in weekly writing

≈ Leave a comment

Tags

chronologies, data, temporal, visualization

Whilst looking at some of the processes involved in actually creating a temporal visualization, I was struck by a thought; how do we think of data whilst it is in the process of being digitally visualized?

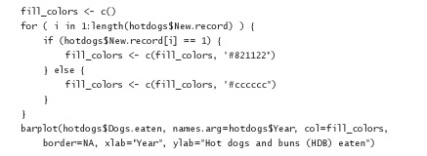
Consider something as simple as building a graph which illustrates the frequency of several discrete occurrences over time.  Nathan Yau does so in his “Visualizing Patterns over Time” chapter of Visualize This and demonstrates the steps taken in this process.  From recording the data, to organising it within a spreadsheet, to writing the code that will command the software to build the visualization.  There is a point in this process where one component of the data is this code (2004, 101):

Image

What does this data mean?  It tells us nothing of what the end visualization will look like as we cannot see the original data nor the software which will be used to create the visualization.  However at this point it is one of three ‘parts’ needed to construct the bar graph.  Does it have no value to us alone?  Or can it tell us of the authors intentions and the construction of his narrative?

This question becomes even more complicated in this temporal visualization of the film The Iron Giant.  Kevin L. Ferguson, Assistant Professor in the Department of English, CUNY illustrates the process of converting a film to data that can then be visualized in his blog.  He breaks the film into over 100,000 frames, classifies each of them within Excel and then creates visualizations based on a number of different factors.  This example plots length of shot against the timeline of the film:

Image

These examples highlight the transformative steps taken to visualize data.  But how does this process equate to that of traditional historical chronologies?

Proof and Intuition

29 Sunday Sep 2013

Posted by Steven Lubar in weekly writing

≈ Leave a comment

Since last week’s class I’ve found myself thinking about two topics that we touch on in our discussion. Both are very general, but it seems to me they go to the heart of some of the issues that we need to deal with as we think about how the digital turn shapes our work in the humanities (in my case, in history).

Proof. How do you prove things in history-writing? It seems a central question, but I’ve never really thought about it in such blatant terms. You make a rhetorical case, you show your evidence, you explain why the evidence makes your argument more likely than another, you give explanations for evidence that suggests otherwise, you describe alternate explanations fairly and show where they don’t fit the evidence, or work as well as your explanation…  Then, you explain why this is is important, why it answers questions that historians are interested in.

But it’s not quite proof. Not what passes for proof in a positivist view of science, where being able to prove something wrong is key.

Digital evidence and digital manipulation seems more scientific, and therefore might lure us into positivist ideas about our work. It seems to me that that’s a false promise; we can still be just as contextual, hermeneutical, and historicist, and just as little positivist, with a new kind of evidence.

Intuition. As a historian, I pride myself on historical intuition. I think I can tell when, say, something seems out of its right time; when something seems odd for its period; when an argument seems unlikely. I’ve read a good bit, looked at many artifacts, and have a feeling – an intuition – for this.

Object ID: 18312467 Accession Number: 1926-22-491 Acquired: 1926 Short URL: http://cprhw.tt/o/2BREc/ Side Chair, ca. 1840. Mahogany veneered oak and ash (frame), solid mahogany (legs, arms, and back), brass (coasters). Bequest of Mrs. John Innes Kane. 1926-22-491.

In the material culture world, we call people with an expert intuition for things connoisseurs, and a good connoisseur can date and locate for a piece of furniture, say, with remarkable precision.  Language works the same way; that’s what makes anachronism in movies and TV so much fun. (See Hillary’s post for more on this.)

But I know that sometimes I’m completely wrong. That’s how history-writing works; revisionism is important!

And so, when we look at the results of a digital history project, and say, yes, that fits my intuition, that’s not a bad thing – most historical projects fit within our sense of how things were. The project does what we might call normal history – it provides more evidence for our existing model.

Every so often, though, we see major changes, important revisions in our work. The last major experiment with the digital in history, the cliometric revolution of the 1980s, when economists brought their theory to history, claimed major changes in interpretation. It made many historians nervous, and indeed, sometimes, those historians’ intuitions proved correct. But not always.

New kinds of data, new kinds of interpretation, new approaches; they hold out the promise that we might see exciting new revisions not only in how we think about history, how we make arguments, and how we understand change in the past; but also about particular historical stories we tell. And that would be good.

Digital humanities is transformative because it is polyvocal and public

23 Monday Sep 2013

Posted by Steven Lubar in weekly writing

≈ Leave a comment

Adding another thought to Massimo’s post about the ways in which the digital humanities can be transformative. It is generative not only because it is about building but also because it can be about building in the open, and not by oneself, but with others.

I’m drawing here on Digital_Humanities. Consider two quotes:

Digital, polyvocal expression can support a genuine multiverse in which no single point of view can claim the center.

and

It serves to make humanities research into something of a new multi-player online game with global reach and relevance.

There’s no tradition of making all of your notes and primary sources available in the traditional humanities, just a very structured system of footnote references that is itself part of the argument. But digital humanities tends toward openness, as Jessop describes in the London Charter.

When that data is revealed, others can work with it too. There’s room for a new kind of data-based debate, for many voices to contribute. This might open the humanities up to a broader public – if not quite a multiversd, and not quite a multi-player game, a public humanities much more welcoming than the traditional forms of analysis and publication allowed. (Though there will be new restrictions on access based on technical skills; part of the job of public digital humanists is to think about how to overcome them.)


Daniel Johnson introduction

16 Monday Sep 2013

Posted by Steven Lubar in weekly writing

≈ Leave a comment

Week 2 Readings/Introduction

Hello Everyone! I am Daniel Johnson and I have been working in Special Collections as Brown for about one year as the project archivist for the Gordon Hall and Grace Hoag Collection of Extremist and Dissenting Printed Propaganda. In this position I am tasked with organizing ~1600 boxes of extremist material collected by Gordon Hall and purchased by Brown.  Additionally, as part of the project I will be researching and providing data on the ~35,000 organizations in this collection.  I current have data on about 1600 organizations and will most likely be using this for my class project. My background is in archives and database management having spent 5 years working at The HistoryMakers African American Video Oral History Archive in Chicago before coming to Brown.

In the Nathan Yau reading something he wrote really got me thinking about my project:

“When it’s said and done, here’s what you need to know. Approach visualization as if you were telling a story. What kind of story are you trying to tell? Is it a report, or is it a novel? Do you want to convince people that action is necessary?”

This statement seems very simple but it is something that had not occurred to me and has provided me with a new approach to my project. Rather than just collecting pieces of data I should look at the data I have so far, see what stories are there and then try to flesh out those stories as I collect data moving forward. This will help me figure out a way to organize and share the data from my collection in a compelling way. Part of the challenge will be figuring out what kind of story I am trying to tell. Due to the size of the collection and the amount of data I hope to gather, having a story to tell should help make sense of disparate pieces of information. I think that I have a few options to start with:

  1. Gordon Hall’s Story – What items was he collecting, when did he collect them, where are they from? What is his story and how is that represented in the collection.
  2. Extremism in Relation to American History – What types of groups existed at various points in American History. Is there a relationship between national or local trends.
  3. Extremist Groups Interrelationships – How are members and groups related to one another. Are groups created as a reaction to other groups?

Stray Thoughts:

The Stafford reading seemed to create a dichotomy between written and visual communication, where historically visual culture “suffered from a low status.” Stafford also argues that we are entering into a visual world, but that only seems to be half right. She creates a scenario where written and visual communication are in opposition to each other, where I see them as being related to one another.

A lot of the other readings whether it is Tufte, Manovich or Yau advise the readers that creating useful visualization requires some sort of a combination of written and visual components. This also seems to be reflected in the world we live in. The line between visual and written communication only seems to be getting more blurred, whether it is television (the amount of text on screen during a sporting event), art (the use of text in painting), and even more so with the internet (It is hard to find any visual online without some sort of text counter part). It occurred to me that it might not be so productive to think about text and image as opposites, but as equal parts in creating one whole.

Enter your email address to follow this blog and receive notifications of new posts by email.

Join 25 other followers

Authrs

  • alessandrocarpin
    • Flip-Flop
    • More dimensions, more opportunities
    • Text, database, narrative
    • Collections, landascapes (and video games)
    • Networks and Methodology
  • danielhjohnson
    • 3-D Modeling and Printing
    • Digital Humanities in A/V Archives
    • Week 9: 3-D Immersion
    • Interpreting Genre
    • Interface vs. Content Management
  • gigipollo
    • Project is here
    • learning from touch with identical artifacts,
    • Archiving the Present
    • DIgital Storytelling
    • Computational Culture
  • hnbrady
    • Week 3 Thoughts
    • Week 2 Readings
  • jabauer
    • Open Lab Today 3 – 5pm
    • Jean speaking at Joukowsky Tomorrow (Thursday, October 31) 12pm
    • Data for Today
    • Timeline.js Pros and Cons
    • Change to Lab Schedule
  • Galehault
    • Remember, Today Sarah McPhee’s lecture on Virtual Rome, List 110, 5:30PM
    • Eco on Fakes
    • Uncertainty and (3D) mapping
    • Bernie Frischer on 3D Archeology
    • Graphs, Maps, Trees
  • nicolemeehan
    • Process as value
    • Layers of interpretation
    • Text – Image – Digital
    • Collections – Databases
    • Network Analysis – Nicole
  • D. Brown
    • Today’s little bug?
    • Teaching in 3D
    • Teaching in 3D
    • Collections
    • networks
  • Steven Lubar
    • Call for Papers: Lost Museums Colloquium
    • Information Visualization MOOC
    • Reminder: No class today
    • Reminder, no class today. Presentations next week.
    • No class 11/25
  • vfederici2013
    • Making anew
    • Mediation, hierarchy, authorship
    • Objective truth
    • Visual narratives: text as image
    • Collectible Knowledge
  • yuanyuandai
    • Re- think, Re- make
    • 3D visualization for humanities
    • Interpreting Database
    • Networks and Humanities
    • Yuanyuan’s post week4
  • zoelanger2013
    • Authorship and reproduction
    • Thoughts about reconstructions
    • Categories, Narrative, and Data in Literature
    • Thinking about classification
    • Thinking critically about maps – Zoe

class mechanics class notes for class this week Uncategorized weekly writing

Meta

  • Register
  • Log in
  • Entries feed
  • Comments feed
  • WordPress.com

Create a free website or blog at WordPress.com.

  • Follow Following
    • AMST2661 Visualizations in the Humanities
    • Join 25 other followers
    • Already have a WordPress.com account? Log in now.
    • AMST2661 Visualizations in the Humanities
    • Customize
    • Follow Following
    • Sign up
    • Log in
    • Report this content
    • View site in Reader
    • Manage subscriptions
    • Collapse this bar
 

Loading Comments...